A metric glossary on all metrics collected by the Danu system will be available here soon.
Work in progress.
Metrics
If you would like to learn more about the metrics collected by the DANU system or need to review definitions, please refer to our glossary below.
stability score
Stability Score
The Stability Score is a custom DANU metric that quantifies balance performance during an assessment. It identifies the longest period of stable standing, based on pressure thresholds and vertical orientation, then calculates features from that region. One key feature is the 95% ellipse, which captures 95% of the center of pressure (CoP) points. The area of this ellipse reflects postural stability: a larger area indicates more sway and less stability. To account for sock size, the ellipse area is normalised against a theoretical maximum for each size. Finally, the Stability Score is computed by exponentially scaling this normalised area to a 0–10 range, where 10 indicates high stability.
Gait Cycle In-Depth
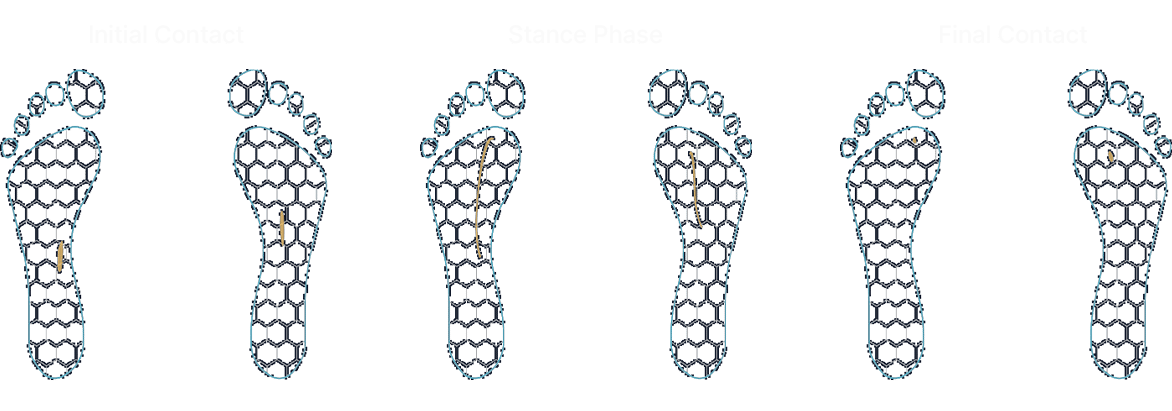
The stance phase can be split into further sub phases, beginning with ‘initial contact’, so the moment the foot touches the ground. This is followed by the ‘loading response’, a phase where the body begins to transfer weight onto the leading foot. ‘Mid stance’ occurs as the body’s weight moves directly over the supporting limb, providing stability at the midpoint of the stance phase. ‘Terminal stance’ marks the point where the foot begins to lift off the ground, propelling the body forwards. The stance phase finally ends with ‘Toe-off’, the point when the foot completely leaves the ground.
The swing phase can be split into three sub phases, the first being ‘initial swing’, where the foot lifts from the ground and the leg starts to move forward. During ‘mid swing’, the foot moves directly beneath the body as the leg continues to advance. The phase culminates in ‘terminal swing’, preparing the foot for the next contact with the ground at the start of the new cycle.

area of ellipse
Area of Ellipse
The area of ellipse, often called the 95% confidence ellipse area or sway area, is commonly used to quantify postural sway based on centre of pressure (CoP) data. It reflects the amount of space the users balance shifts occupy over time. It is calculated as:
Metric Expla
Where: α = semi-major axis (half the longest radius of sway), b = semi-minor axis (half the shortest radius of sway. The area is given in mm2.
length of ellipse
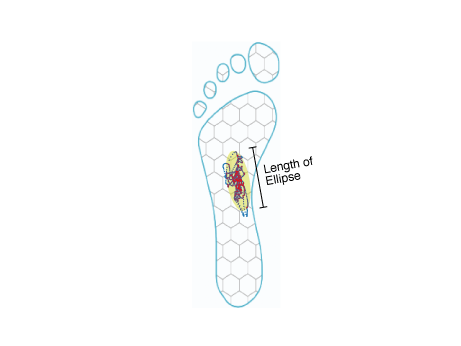
Length of Ellipse
The length of ellipse in balance assessments refers to the major axis of the ellipse fitted to the centre of pressure. It refers to the longest sway path direction, indicating the primary direction of postural instability or movement during a balance assessment. A longer major axis suggest greater variability or excursion in that direction, which may reflect reduced balance control or direction instability.
Gait Cycle In-Depth
The stance phase can be split into further sub phases, beginning with ‘initial contact’, so the moment the foot touches the ground. This is followed by the ‘loading response’, a phase where the body begins to transfer weight onto the leading foot. ‘Mid stance’ occurs as the body’s weight moves directly over the supporting limb, providing stability at the midpoint of the stance phase. ‘Terminal stance’ marks the point where the foot begins to lift off the ground, propelling the body forwards. The stance phase finally ends with ‘Toe-off’, the point when the foot completely leaves the ground.
The swing phase can be split into three sub phases, the first being ‘initial swing’, where the foot lifts from the ground and the leg starts to move forward. During ‘mid swing’, the foot moves directly beneath the body as the leg continues to advance. The phase culminates in ‘terminal swing’, preparing the foot for the next contact with the ground at the start of the new cycle.
width of ellipse
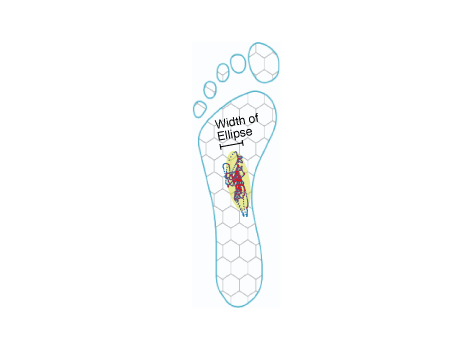
Width of Ellipse
The width of ellipse refers to the minor axis of the ellipse fitted to the Centre of Pressure (CoP). It represents the shortest direction of sway, perpendicular to the major axis. The width indicates variability in that direction, and when assessed alongside the length (major axis), it helps describe the overall shape and directional tendencies of postural sway. A wider ellipse may suggest greater instability or movement in the medio-lateral or anterior-posterior direction, depending on how the axes are oriented.
Gait Cycle In-Depth
total displacement
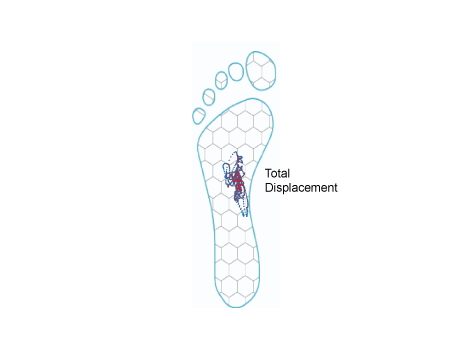
Total Displacement
In balance assessments, total displacement refers to the sum of all distances travelled by the Centre of Pressure (CoP) over the duration of a task. It quantifies how much the CoP moves, regardless of direction, and is typically measured in millimetres (mm). A great total displacement generally indicates less postural stability, as the individual is swaying more to maintain balance. It is computed as the cumulative distance between consecutive CoP points:
Total displacement Formula Diagram Total displacement Formula Diagram
The stance phase can be split into further sub phases, beginning with ‘initial contact’, so the moment the foot touches the ground. This is followed by the ‘loading response’, a phase where the body begins to transfer weight onto the leading foot. ‘Mid stance’ occurs as the body’s weight moves directly over the supporting limb, providing stability at the midpoint of the stance phase. ‘Terminal stance’ marks the point where the foot begins to lift off the ground, propelling the body forwards. The stance phase finally ends with ‘Toe-off’, the point when the foot completely leaves the ground.
The swing phase can be split into three sub phases, the first being ‘initial swing’, where the foot lifts from the ground and the leg starts to move forward. During ‘mid swing’, the foot moves directly beneath the body as the leg continues to advance. The phase culminates in ‘terminal swing’, preparing the foot for the next contact with the ground at the start of the new cycle.
medio lateral range
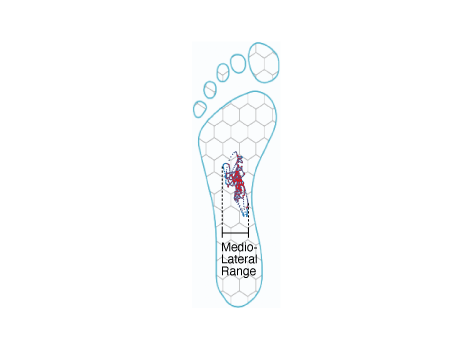
Medio-lateral range
The medio-lateral (ML) range refers to the side-to-side displacement of the Centre of Pressure (CoP) during a balance task. It is calculated as the difference between the maximum and minimum CoP values in the medio-lateral (x-axis) direction. It reflects how much the individual sways left and right while maintaining balance. A larger ML range may indicate reduced lateral stability or compensatory strategies, especially in populations with balance impairments. It is calculated as:
Total displacement Formula Diagral dis
The stance phase can be split into further sub phases, beginning with ‘initial contact’, so the moment the foot touches the ground. This is followed by the ‘loading response’, a phase where the body begins to transfer weight onto the leading foot. ‘Mid stance’ occurs as the body’s weight moves directly over the supporting limb, providing stability at the midpoint of the stance phase. ‘Terminal stance’ marks the point where the foot begins to lift off the ground, propelling the body forwards. The stance phase finally ends with ‘Toe-off’, the point when the foot completely leaves the ground.
The swing phase can be split into three sub phases, the first being ‘initial swing’, where the foot lifts from the ground and the leg starts to move forward. During ‘mid swing’, the foot moves directly beneath the body as the leg continues to advance. The phase culminates in ‘terminal swing’, preparing the foot for the next contact with the ground at the start of the new cycle.
antero posterior range
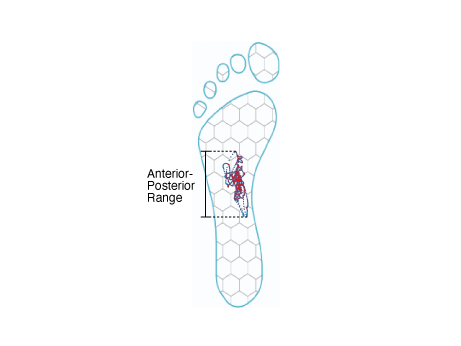
Anterior-posterior range
The anterior-posterior (AP) range refers to the forward and backward displacement of the Centre of Pressure (CoP) during a balance task. It is calculated as the difference between the maximum and minimum CoP values in the anterior-posterior (y-axis)direction. It reflects the amount of forward-to backwards sway while maintaining balance. A larger AP range may suggest greater difficulty controlling balance in the sagittal plane, often seen in populations with motor or proprioceptive impairments. It is often used alongside medio-lateral range to assess the overall postural stability and sway patterns. It is calculated as:
Total displacement Formula Diagram Total displacement Formula Diagram
The stance phase can be split into further sub phases, beginning with ‘initial contact’, so the moment the foot touches the ground. This is followed by the ‘loading response’, a phase where the body begins to transfer weight onto the leading foot. ‘Mid stance’ occurs as the body’s weight moves directly over the supporting limb, providing stability at the midpoint of the stance phase. ‘Terminal stance’ marks the point where the foot begins to lift off the ground, propelling the body forwards. The stance phase finally ends with ‘Toe-off’, the point when the foot completely leaves the ground.
The swing phase can be split into three sub phases, the first being ‘initial swing’, where the foot lifts from the ground and the leg starts to move forward. During ‘mid swing’, the foot moves directly beneath the body as the leg continues to advance. The phase culminates in ‘terminal swing’, preparing the foot for the next contact with the ground at the start of the new cycle.
Daily Load
Daily Load
Daily Load is the accumulation of Total Load across all sessions and activities performed in a single day. It reflects the overall mechanical stress or movement intensity experienced throughout that day. A higher Daily Load typically indicates greater activity, intensity, or loading impacts, making it a valuable metric for tracking rehabilitation progress, monitoring training load, and identifying asymmetries between the left and right legs.
Large text to make the stinky
graph big read
La
Using drive index, coaches are able to classify movement strategies as air-base (low drive index score), ground-based (high drive index score), or a neutral strategy (mid-point drive index value). However, it is crucial to point out no strategy is optimal and each strategy will benefit individuals differently.
Total Load
Total Load
Total Load is a metric used to quantify the external physical demands placed on an athlete during movement. It is most commonly calculated using accelerometers and is based on a modified vector magnitude. This metric captures the total amount of movement across the three planes: vertical, lateral, and antero-posterior. Total Load represents the sum of all acceleration experienced by a limb during a session, including running, cutting, jumping, and landing, providing a single value that reflects how physically demanding the activity was.
It is calculated for each limb as:
Large text to make the Text Box
graph big enough to read
Large text to make the Large text to make the Text Box
Using drive index, coaches are able to classify movement strategies as air-base (low drive index score), ground-based (high drive index score), or a neutral strategy (mid-point drive index value). However, it is crucial to point out no strategy is optimal and each strategy will benefit individuals differently.
Countermovement Jump
Countermovement Jump
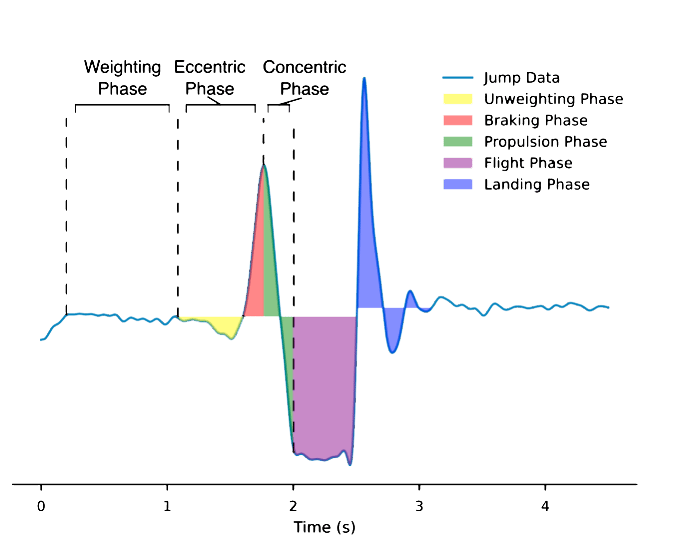
The countermovement jump (CMJ) is a key exercise for assessing an athlete’s neuromuscular function. While often used to measure jump height, the real value comes from analysing the force-time curve, which reveals insights into performance, fatigue, and injury status. This data helps identify areas for improvement and allows for ongoing monitoring to track changes and adjust training. There are six key phases of the CMJ which are broken down below:
Large text to make the Teeeeeeext Box
graph big enough to read
Large text to make the
1. Weighing Phase: The CMJ begins with the weighing phase. This is where the athlete stands as still as possible, usually for at least 1 second. The purpose of this phase is to take an accurate calculation of body weight, allowing to accurate identify a threshold to determine the onset of movement, and is included in forward dynamics procedures.
2. Unweighting Phase: The second CMJ phase is the unweighting phase. It occurs immediately after the weighing phase and marks the beginning of the movement. During this phase, the athlete lowers their body in preparation to jump, causing the vertical ground reaction force to drop below their body weight. This drop indicates that the athlete is actively moving downward. The unweighting phase plays a crucial role in the stretch-shortening cycle, allowing muscles and tendons to store elastic energy that contributes to a more powerful take-off.
3. Braking Phase: The braking phase of a CMJ follows the unweighting phase and is when the athlete begins to decelerate their downward movement. Although the body is still moving down, the muscles are now generating force to slow this descent in preparation for the upward jump. During this phase, the vertical ground reaction force rises above body weight as the athlete resists gravity and transitions from lowering to pushing. The braking phase is a key indicator of eccentric strength, control, and how efficiently the athlete can absorb and redirect force; important qualities for both performance and injury prevention.
4. Propulsion Phase: The propulsion phase of a CMJ begins immediately after the braking phase and continues until the athlete leaves the ground. During this phase, the athlete shifts from decelerating to accelerating upward, producing force to propel the body off the ground. Vertical ground reaction force remains above body weight, and velocity moves from zero to positive. The propulsion phase reflects the athlete’s ability to generate concentric force and power, making it a key indicator of explosive strength and jump performance.
5. Flight Phase: The flight phase of a CMJ begins the moment the athlete's feet leave the ground and ends when they make contact again. During this phase, there is no ground reaction force, as the athlete is airborne. The body's movement follows a projectile path, and no additional force can be generated. Key performance metrics like jump height and flight time are derived from this phase. The characteristics of the flight phase reflect how effectively force was produced during take-off, and it’s often used to assess overall jump performance.
6. Landing Phase: The landing phase of a CMJ begins when the athlete's feet make contact with the ground after the flight phase. This phase involves rapidly absorbing the impact forces generated during landing, with vertical ground reaction force rising sharply. It requires effective eccentric strength and control to safely decelerate the body and stabilise.
Jump Height
Jump Height
The method for calculating jump height using flight time is a widely accepted and validated method, using the equation below [15]:
Large text to make the Teeeeeeext Box
graph big enough to read
Large text to make the
This method is widely used on jump mats and by force plate manufacturers as the most accurate method for calculating jump height based on flight time.

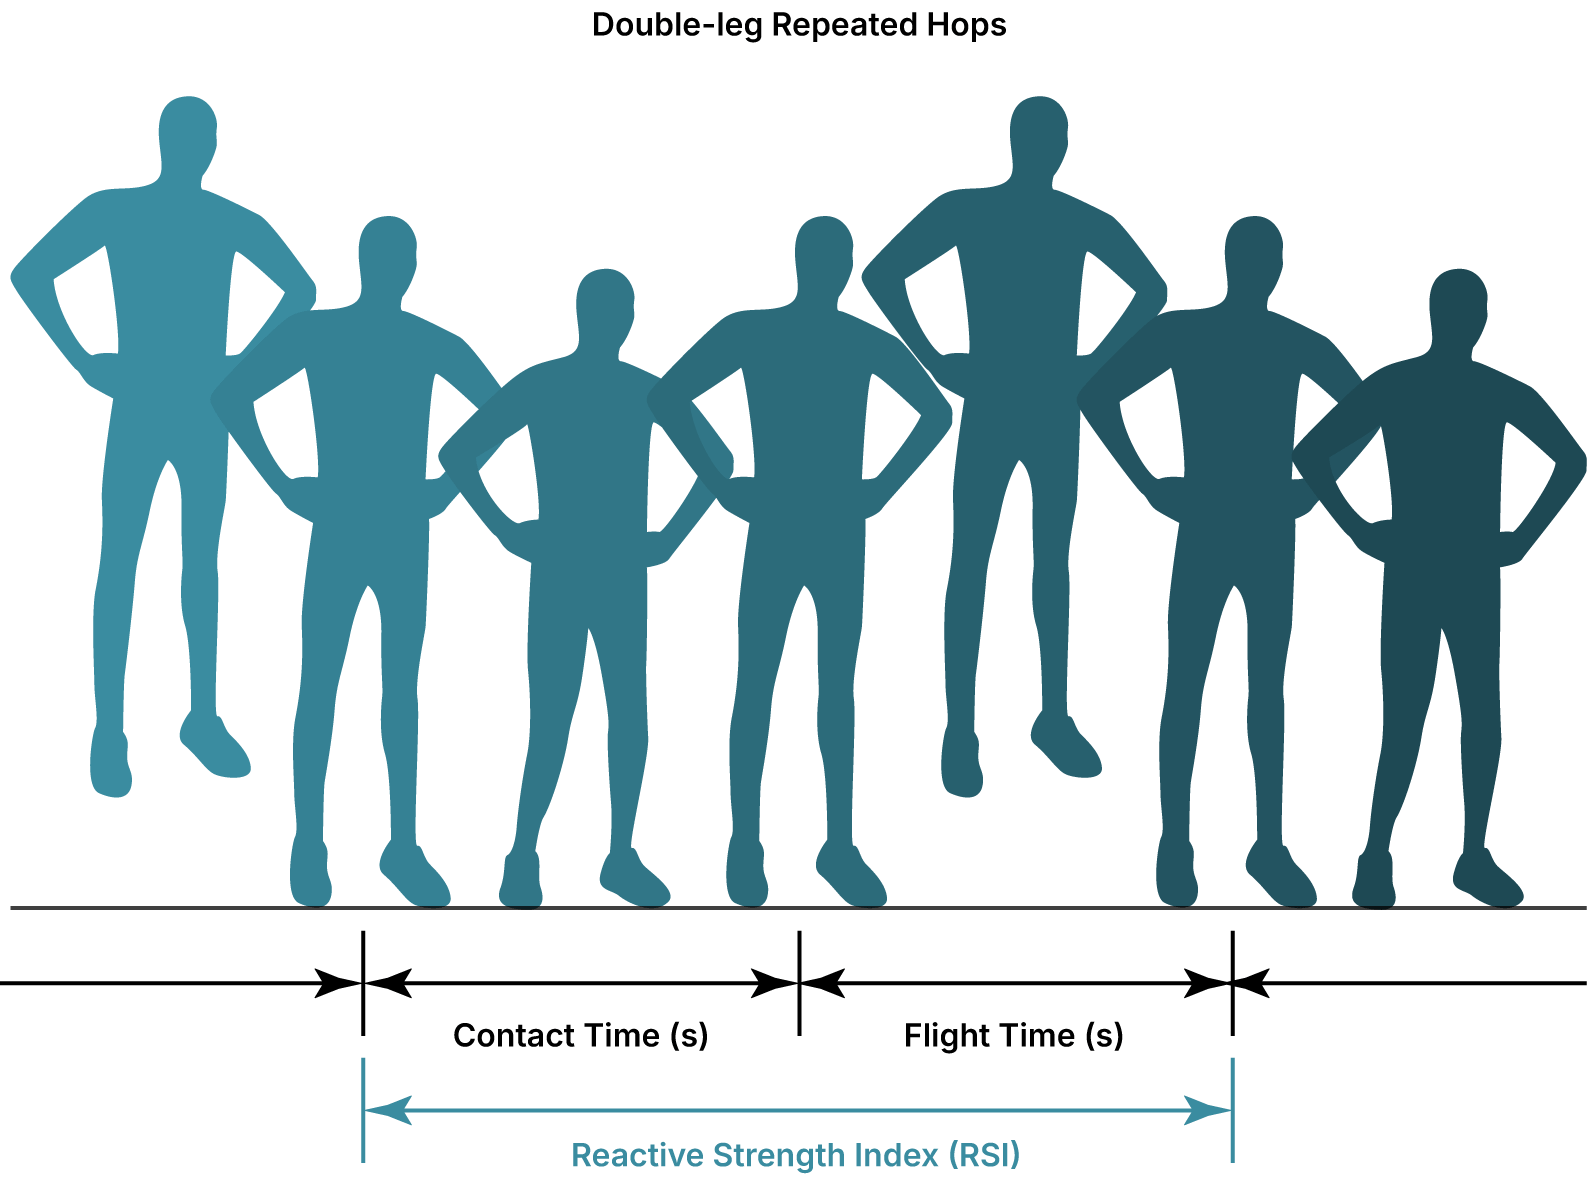
Flight Time
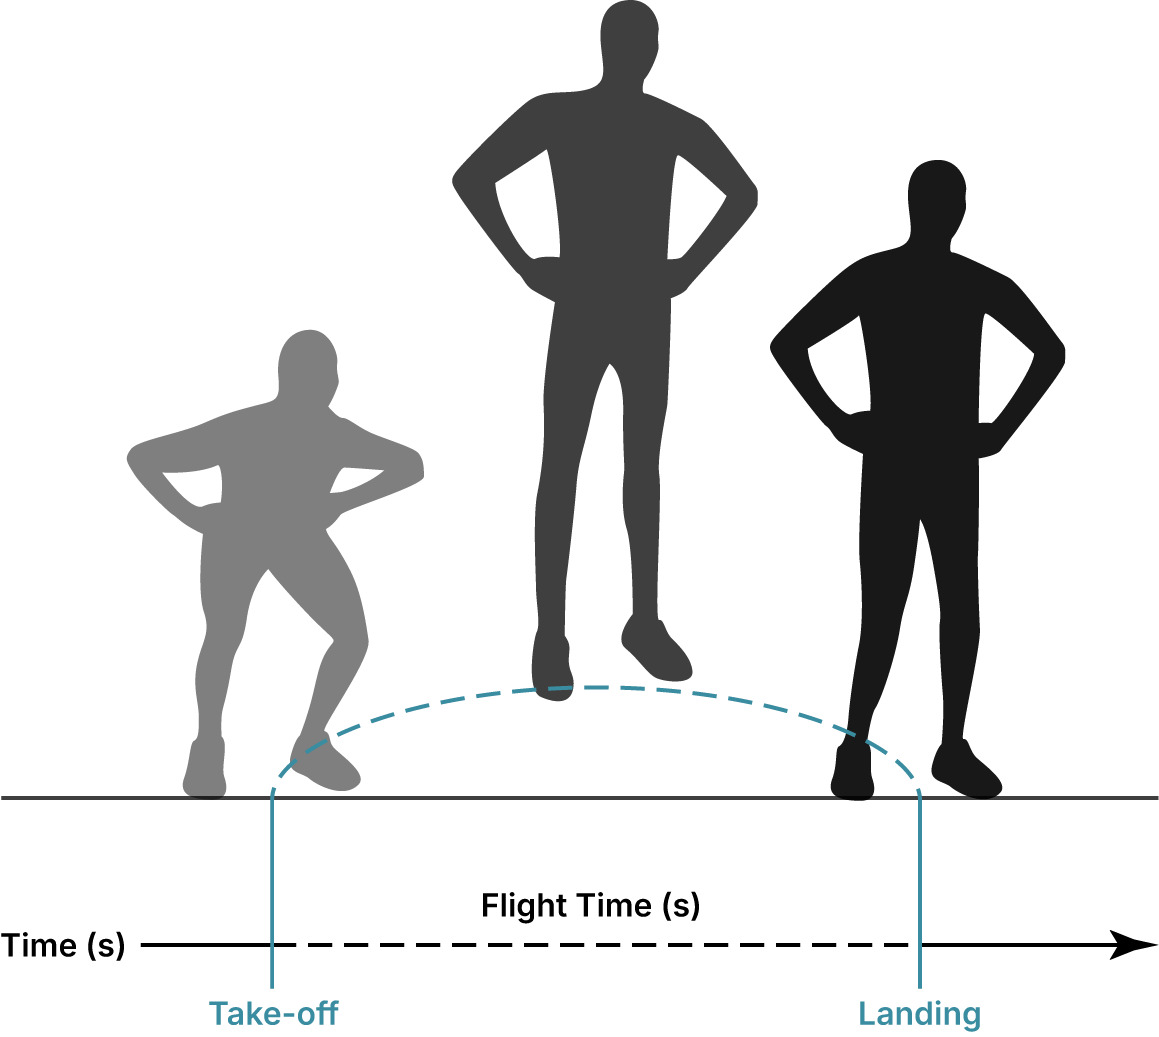
Flight Time
Flight Time is simply the total duration a person spends in the air with no ground contact. It begins at the final contact with the ground (take-off) and ends at initial contact (landing), as visualised on the example graph.
Peak Power
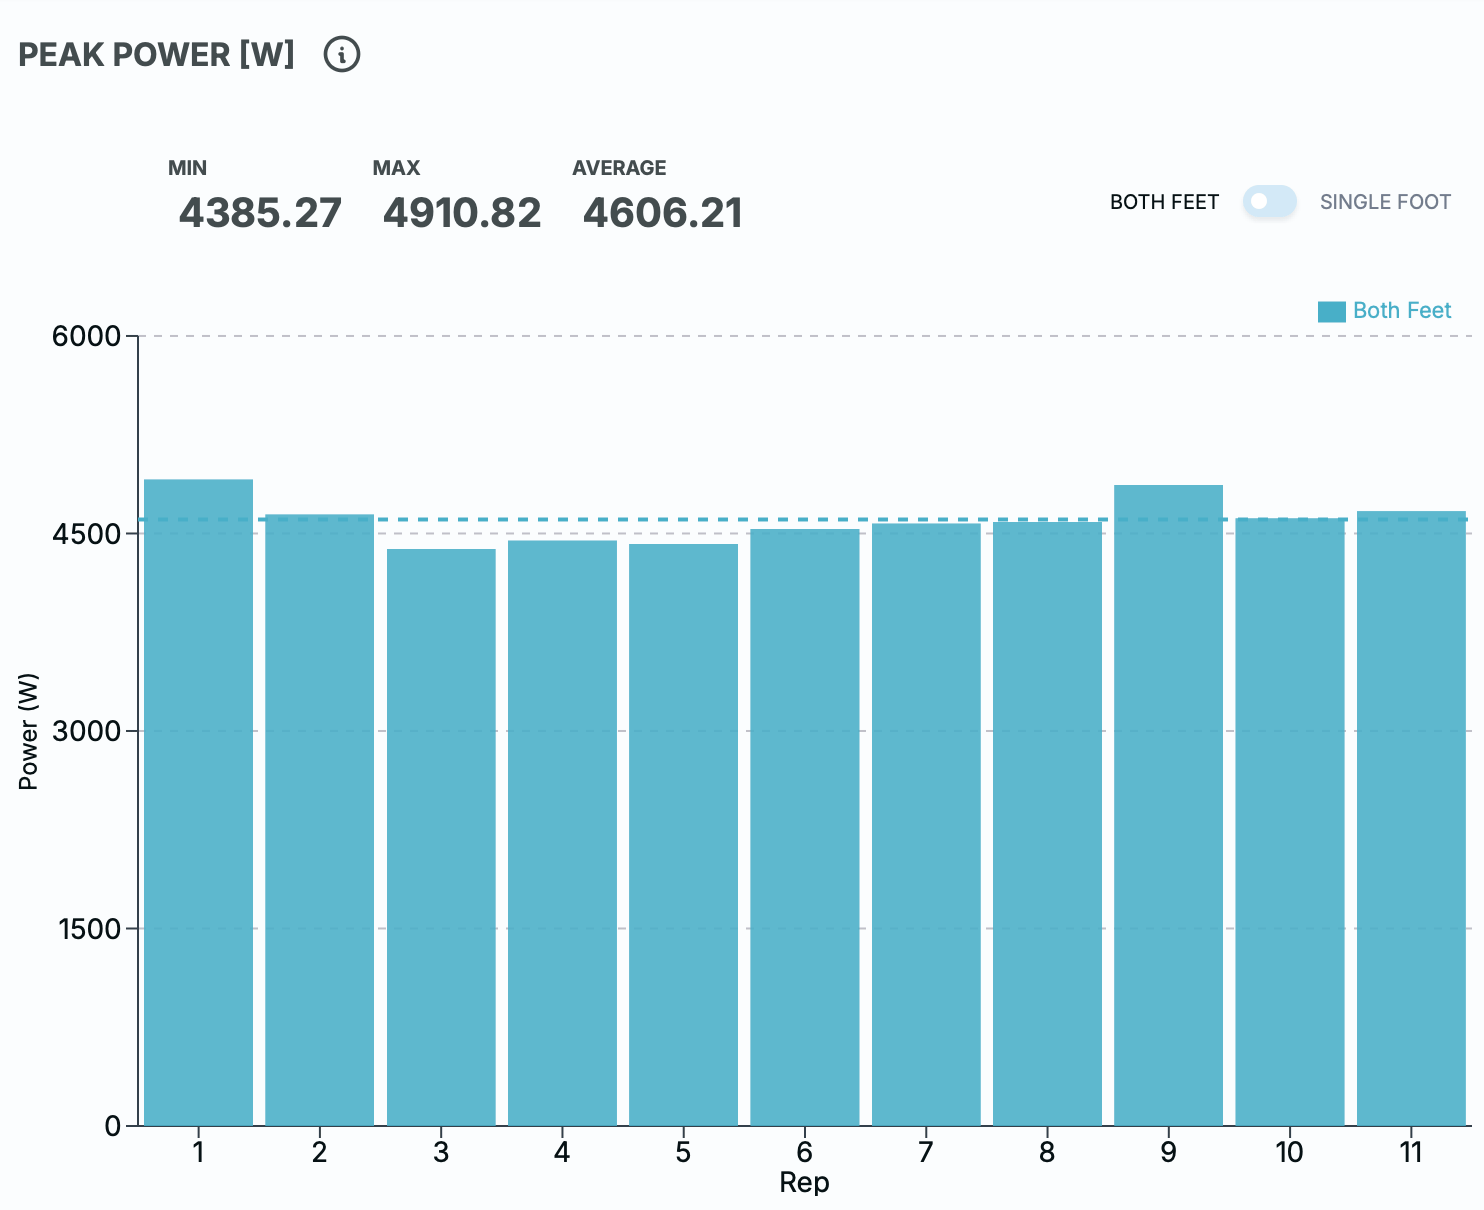
Peak Power
The method for calculating peak power is based on Sayers et al. [16] equation for calculating peak power using an individuals body weight and jump height, as shown in equation the equation below:
( Insert Jump Height Equation )( Insert Jump Height Equation )
This method has been validated against force plates and has been shown to provide accurate estimates of peak power. It is a common method used among other wearable devices and jump mats.
Contact time
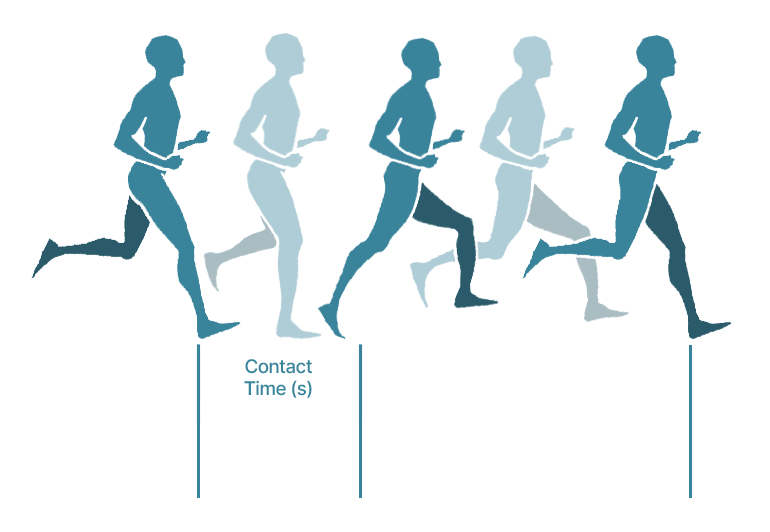
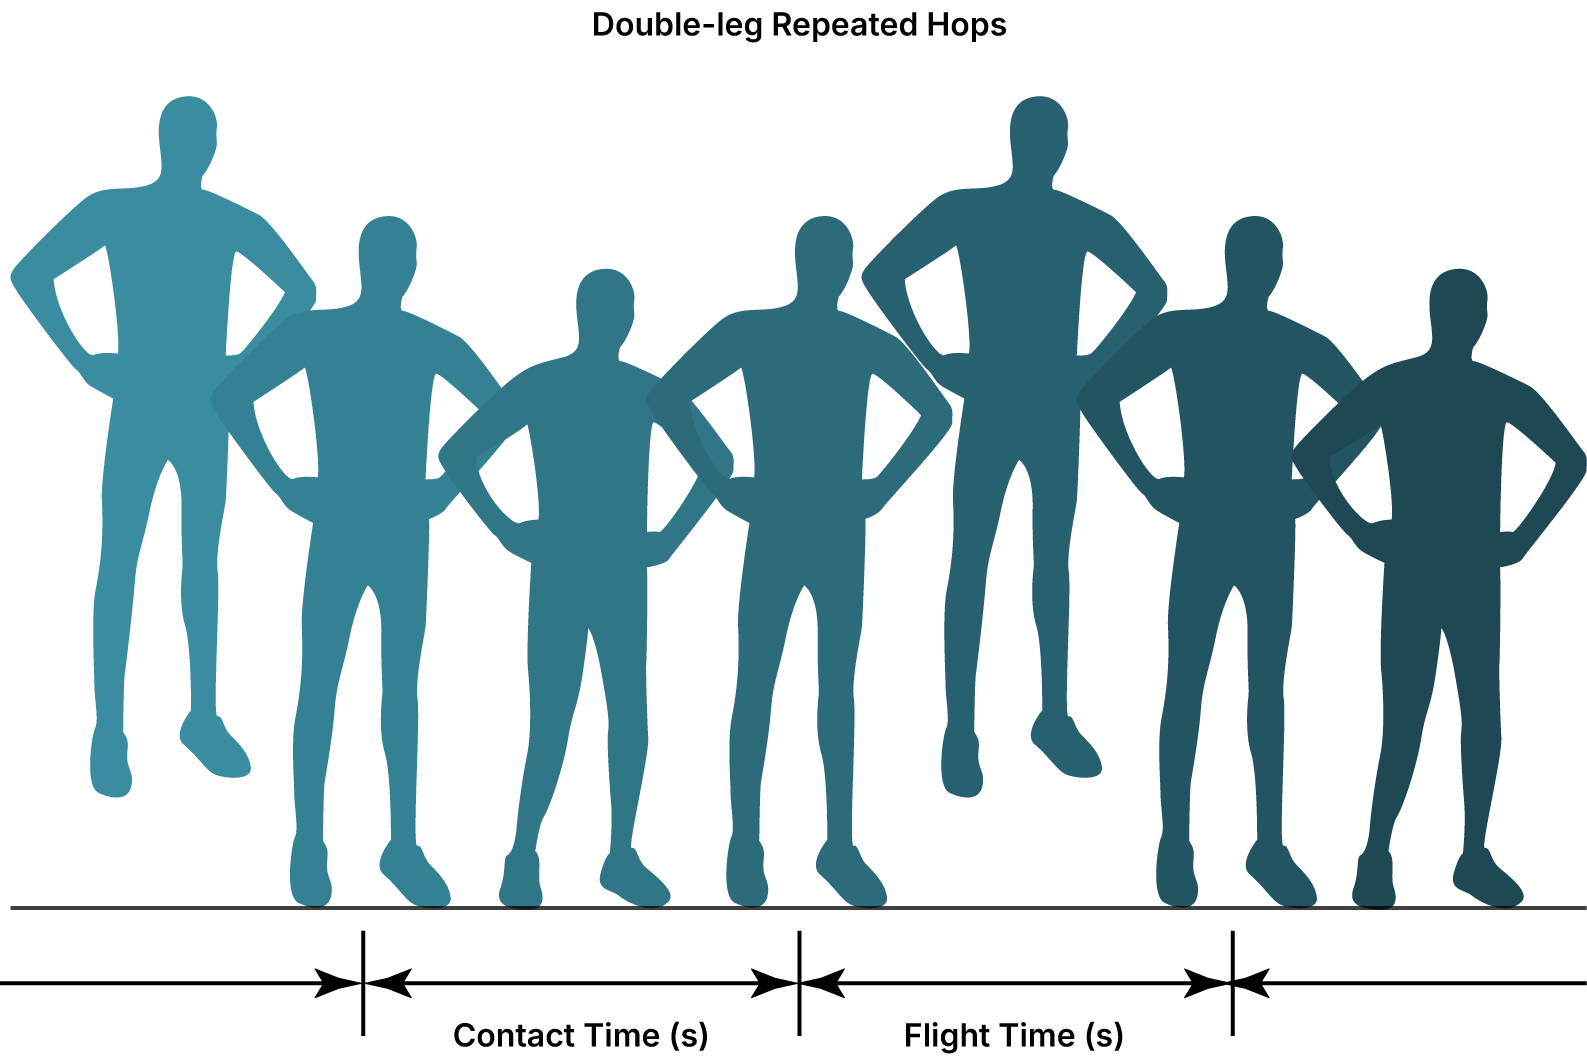
Contact Time
Contact time (CT) is the duration for which the foot is in contact with the ground. It is a critical variable in plyometrics, as shorter contact times typically indicate more explosive, elastic movement patterns, while longer contact times may reflect increased load absorption or neuromuscular efficiency.
( Insert Jump Height Equation )( Insert Jump Height Equation )
This method has been validated against force plates and has been shown to provide accurate estimates of peak power. It is a common method used among other wearable devices and jump mats.
Centre oF Pressure
Centre of Pressure
Centre of Pressure (CoP) during plyometric movements represents the point location of the vertical pressure beneath the feet and serves as an indicator for how the pressure is distributed during the contact with the ground. As an individual performs explosive movements, the CoP dynamically shifts in response to changes in body position, force application, and balance demands. During take-off phases, the CoP typically moves anteriorly and laterally as force is generated to propel the body, while during landing, it reflects how the individual controls impact forces and maintains postural stability. Monitoring CoP trajectories during plyometric tasks provides insight into neuromuscular control, loading strategies, and potential asymmetries or balance deficits, which can be particularly important for injury prevention and performance optimisation.
( Insert Jump Height Equation )( Insert Jump Height Equation )
This method has been validated against force plates and has been shown to provide accurate estimates of peak power. It is a common method used among other wearable devices and jump mats.
Reactive Strength Index
Reactive Strength Index
Reactive Strength Index (RSI) is a metric used to assess an athlete’s explosive strength capabilities, particularly focusing on the efficiency and effectiveness of the stretch-shortening cycle (SSC). The SSC is a natural, elastic response of the muscles, where they elongate (stretch) before immediately contracting (shortening), as seen in variations of jumps. RSI is calculated by dividing the flight time by the contact time during a plyometric activity, such as the drop jump or repeated hops, as shown in equation below:
Large text to make the Text Box
graph big enough to read
Large text to make the
Modified Reactive
Strength Index
modified Reactive Strength Index
Modified Reactive Strength Index is the ratio of Jump Height & Ground Contact Time.
Large text to make the Text B
ox
graph big enough to read
Large text to make the
Large text to make the Text Box
If you are completing a countermovement jump, ground contact time is substituted with Time To Take-Off (TTT).

Daily Load
Daily Load
Daily Load is the accumulation of Total Load across all sessions and activities performed in a single day. It reflects the overall mechanical stress or movement intensity experienced throughout that day. A higher Daily Load typically indicates greater activity, intensity, or loading impacts, making it a valuable metric for tracking rehabilitation progress, monitoring training load, and identifying asymmetries between the left and right legs.
Large text to make the stinky
graph big read
La
Using drive index, coaches are able to classify movement strategies as air-base (low drive index score), ground-based (high drive index score), or a neutral strategy (mid-point drive index value). However, it is crucial to point out no strategy is optimal and each strategy will benefit individuals differently.
Total Load
Total Load
Total Load is a metric used to quantify the external physical demands placed on an athlete during movement. It is most commonly calculated using accelerometers and is based on a modified vector magnitude. This metric captures the total amount of movement across the three planes: vertical, lateral, and antero-posterior. Total Load represents the sum of all acceleration experienced by a limb during a session, including running, cutting, jumping, and landing, providing a single value that reflects how physically demanding the activity was.
It is calculated for each limb as:
Large text to make the Text Box
graph big enough to read
Large text to make the Large text to make the Text Box
Using drive index, coaches are able to classify movement strategies as air-base (low drive index score), ground-based (high drive index score), or a neutral strategy (mid-point drive index value). However, it is crucial to point out no strategy is optimal and each strategy will benefit individuals differently.
Bibliography
Bibliography
[15] | C. Bosco, P. Luhtanen and P. V. Komi, "A simple method for measurement of mechanical power in jumping," European Journal of Applied Physiology, vol. 50, no. 2, pp. 273-82, 1983. |
[16] | S. P. Sayers, D. V. Harackiewicz, E. A. Harman, P. N. Frykman and M. T. Rosentein, "Cross-validation of three jump power equations," Medicine & Science in Sports & Exercise, vol. 31, pp. 572-577, 1999. |
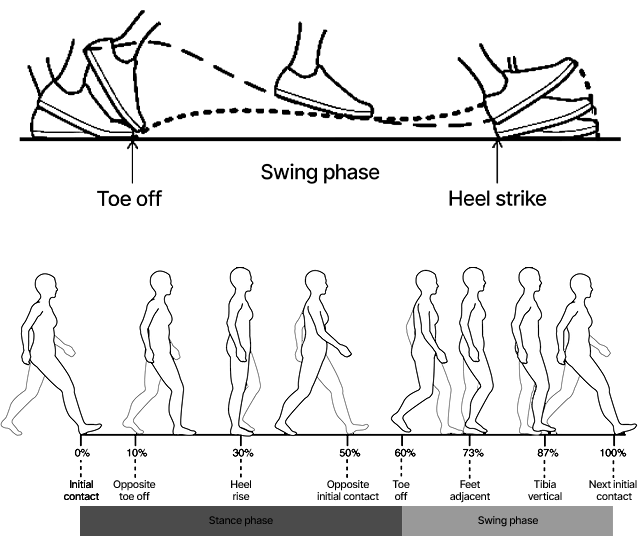
The Gait Cycle
The Gait Cycle
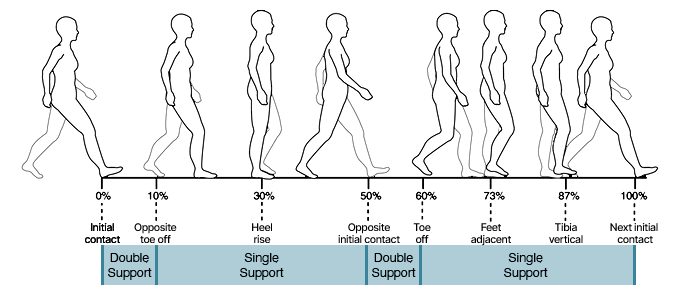
Human gait can be described as a cyclic pattern of movements which advances an individual’s position. The gait cycle consists of two main phases: stance and swing. The stance phase typically occupies 60% of the total walking gait cycle [1], during which some part of the foot is in contact with the ground. The swing phase occupies 40% of the total walking gait cycle [1], during which the foot is not in contact with the ground and the bodyweight is borne by the other leg and foot. This ratio is flipped when looking at jogging or sprinting, where stance phase on average is around ~40% of the gait cycle, and swing phase is around ~60% [2]. To identify the time the foot is in contact with the ground, we need to find initial contact and final contact and forms the base of calculating all temporal metrics.
Gait Cycle In-Depth
The stance phase can be split into further sub phases, beginning with ‘initial contact’, so the moment the foot touches the ground. This is followed by the ‘loading response’, a phase where the body begins to transfer weight onto the leading foot. ‘Mid stance’ occurs as the body’s weight moves directly over the supporting limb, providing stability at the midpoint of the stance phase. ‘Terminal stance’ marks the point where the foot begins to lift off the ground, propelling the body forwards. The stance phase finally ends with ‘Toe-off’, the point when the foot completely leaves the ground.
The swing phase can be split into three sub phases, the first being ‘initial swing’, where the foot lifts from the ground and the leg starts to move forward. During ‘mid swing’, the foot moves directly beneath the body as the leg continues to advance. The phase culminates in ‘terminal swing’, preparing the foot for the next contact with the ground at the start of the new cycle.
DANU GAIT SCORE
DANU GAIT SCORE
The gait score is a bespoke DANU metric that integrates our comprehensive gait parameters to provide a holistic overview of a session. It evaluates gait variability, Asymmetry, Rhythm, and Postural Control. The score ranges from 0 to 100 and is interpreted as follows:
Gait Cycle In-Depth
- 0–25: High variability and asymmetry between left and right metrics – considered Poor.
- 26–50: Noticeable variability and asymmetry – considered Bad.
- 51–75: Moderate variability and asymmetry – considered Okay.
- 76–90: Minimal variability and asymmetry – considered Good.
- 91–100: Very little to no variability or asymmetry – considered Excellent.

Ground Contact Time
Ground Contact Time
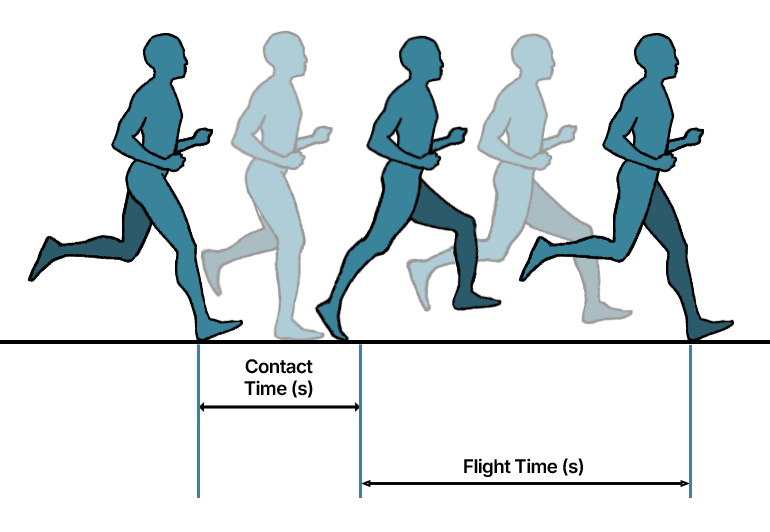
Ground Contact Time (GCT), also known as stance phase, is the amount of time the foot spends on the ground in each stride cycle, defined by initial contact to final contact. It will vary from individual to individual, with walking GCT being longer than running GCT. Within the field of sport, as practitioners are interested in the amount of force an athlete can produce in a short period of time.

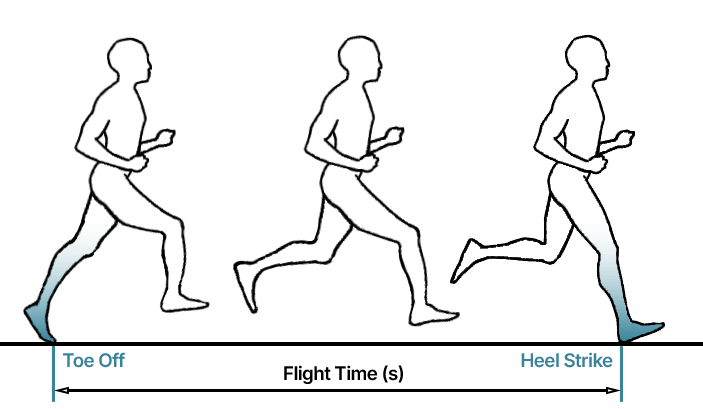
Flight Time
Flight Time
Flight Time (FT) refers to the amount of time during a single gait cycle both feet are off the ground and the body is no longer in contact with the ground. This will vary based on speed and can only be measured during running when there is a no support phase. During walking gait, swing time is used instead.
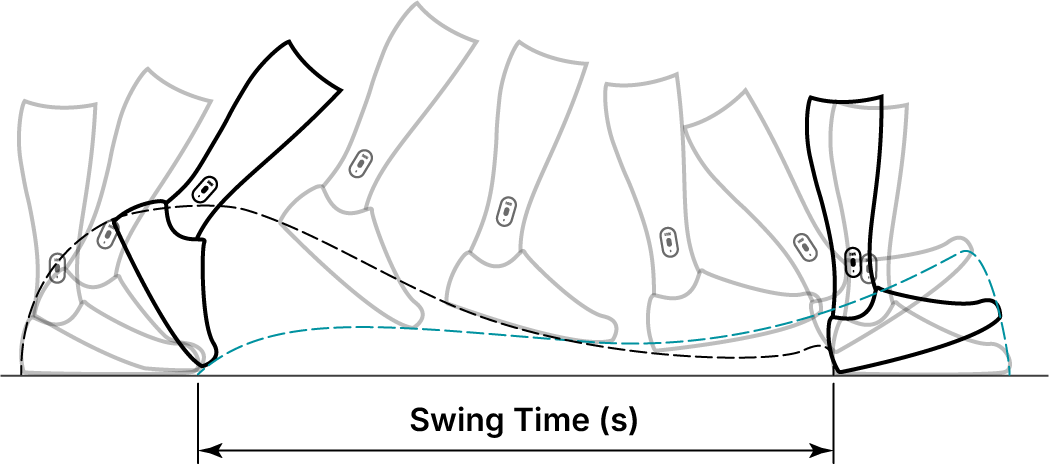
Swing Time
Swing Time
Swing Time (ST) refers to the amount of time during each stride cycle that the foot is off the ground, classified as the time between final contact until initial contact. It will often vary from individual to individual, with walking ST being shorter than running. There is a strong correlation between swing time and increased stride length, specifically when running at submaximal and maximal speeds.
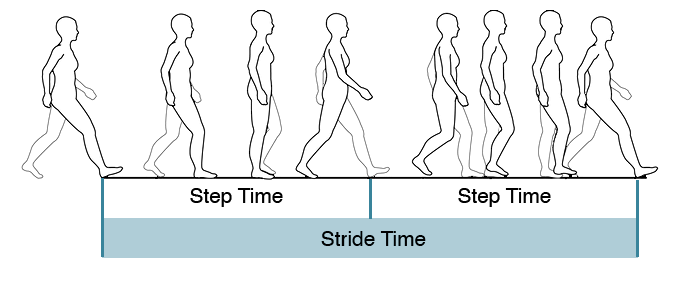
Step Time
STep Time
Step time refers to the duration between the initial contact of one foot and the initial contact of the opposite foot during walking or running. It represents the time it takes to complete a single step and is a key temporal parameter in gait analysis. Step time helps assess the rhythm and symmetry of movement, with consistent step times typically indicating smooth, coordinated gait.
Stride time
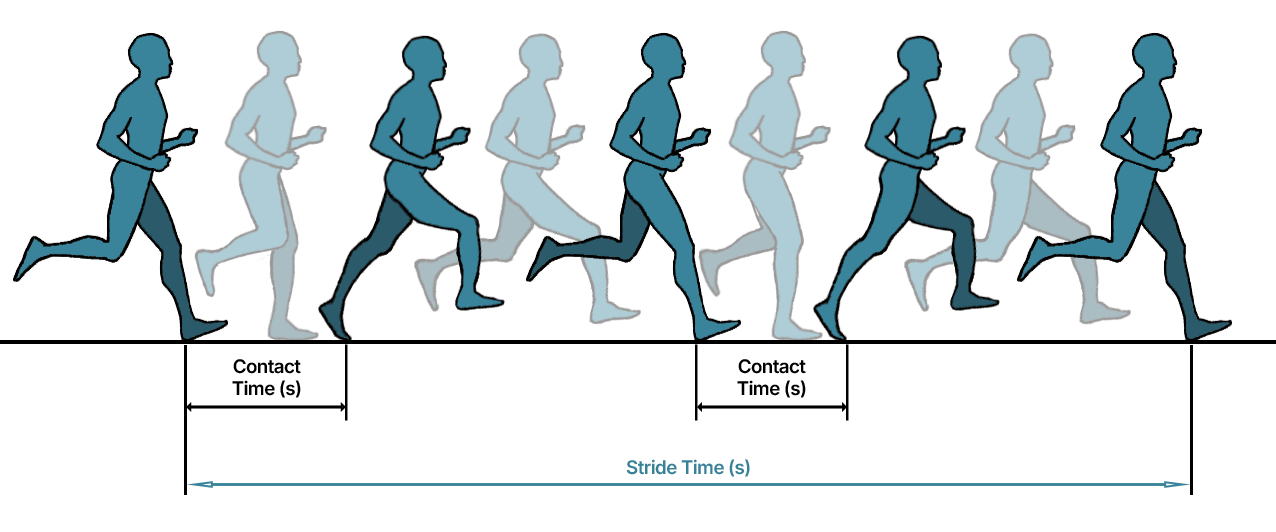
STRIDE Time
Stride time refers to the duration it takes to complete a full gait cycle, which includes two steps; one with each foot. It begins when one foot makes initial contact with the ground and ends when the same foot makes initial contact the ground again. Stride time is a key temporal parameter in gait analysis and is often measured in seconds.
Step Frequency
Step Frequency
Step frequency, often interchangeably used with cadence, is a critical biomechanical parameter in the analysis of athletic performance. It refers to the rate at which an athlete completes a cycle of motion within a given period of time, usually measured in steps taken per minute. Step frequency is inversely related to stride length at a constant speed; as step frequency increases, stride length typically decreases [3].
The number of steps taken per minute (steps/minute). Healthy adults average about 90-120 steps per minute for a comfortable walking speed [4][5].

Stride Frequency
Stride Frequency
Stride Frequency refers to the number of strides an athlete completes within a specific time period, on the Danu portal in strides per second. A stride constitutes a complete cycle of the gait, from terminal contact until the next initial contact of the same foot. This parameter is closely linked to stride length and running speed, influencing the horizontal velocity someone can run at [6].
Peak Tibial Acceleration
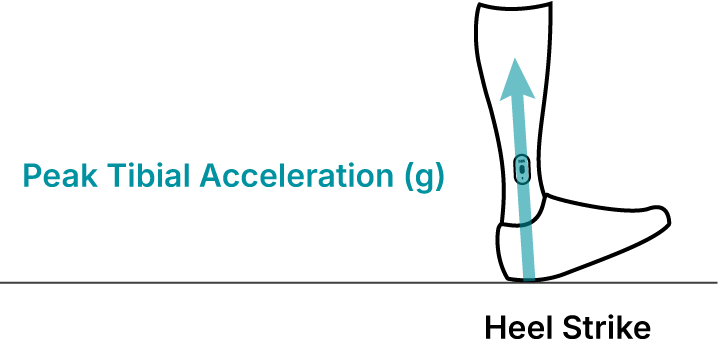
Peak Tibial Acceleration
Peak tibial acceleration refers to the maximum rate of change of velocity of the tibia (shin bone) during movement, especially during activities such as walking, running, or jumping. It's a biomechanical parameter that's often measured in units of 'g-forces' (g), where 1 g is equivalent to the acceleration due to gravity on Earth (about 9.81 m/s²). This biomechanical parameter is crucial in understanding the forces exerted on the lower leg and the potential for injury. From a biomechanical perspective, peak tibial accelerations occur due to the dynamic forces acting on the lower leg during the impact phase of foot contact with the ground. When the foot strikes the ground, a force is transmitted through the foot and up the leg, causing the tibia to accelerate rapidly.
Centre of Pressure
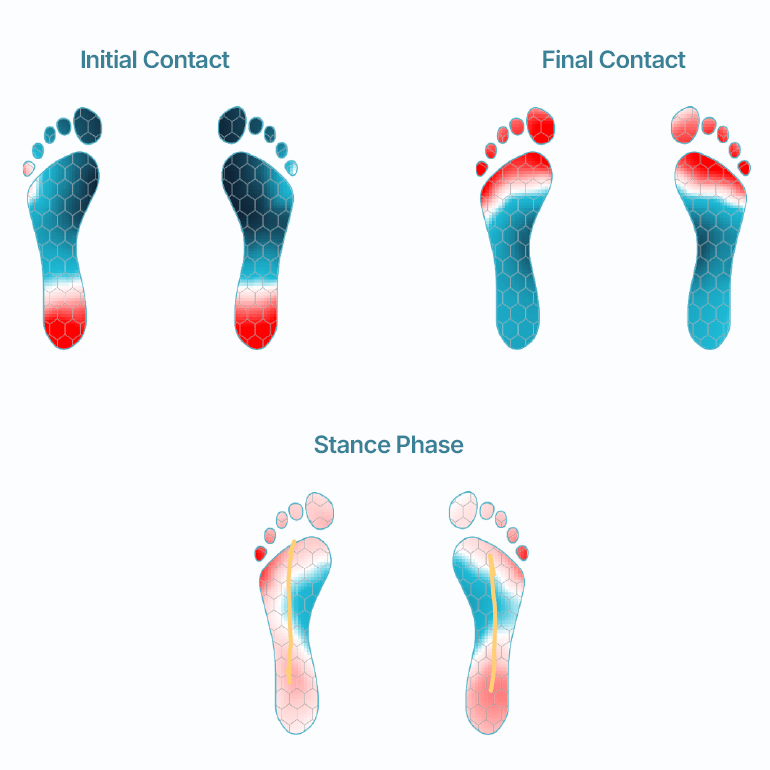
Centre of Pressure
Centre of Pressure (CoP) refers to a point on the ground where the total sum of pressure applied by the foot during walking or running is centred. This point represents the average location of the vertical force that the body exerts on the ground, and it shifts through the gait cycle. The CoP begins at the point of contact for initial contact, and shifts throughout the stance phase, and ending at final contact. The CoP’s trajectory and variation can provide insights into various aspects of gait, including symmetry, stride length, and the presence of gait pathologies.
Centre of Pressure
(Butterfly Diagram)
Centre of Pressure (Butterfly Diagram)
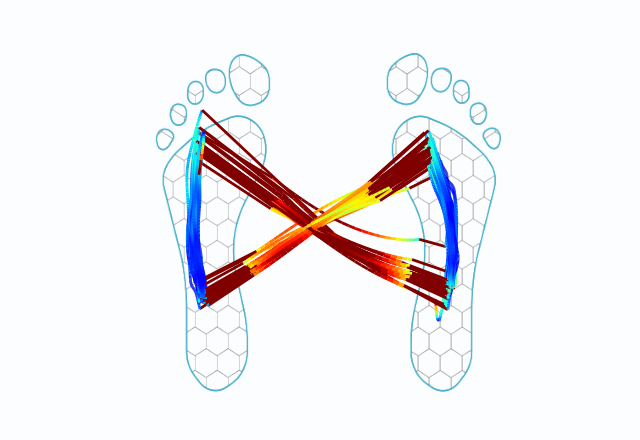
The butterfly diagram, also known as the cyclogram, represents a continuous trace of the centre of pressure (CoP) trajectory during gait. It illustrates the side-to-side (medio-lateral) and forward-backward (anterior-posterior) shifts of the CoP under each foot. Capturing several consecutive steps provides insight into gait symmetry, balance, and weight transfer. Deviations (such as non-symmetrical “wings”) can help to visualise asymmetries, instability, or abnormal gait mechanics. Additionally, the overall shape and consistency of the butterfly diagram can reveal step-to-step variability, offering further information about gait stability and neuromuscular control [14].
Foot Strike
Foot strike
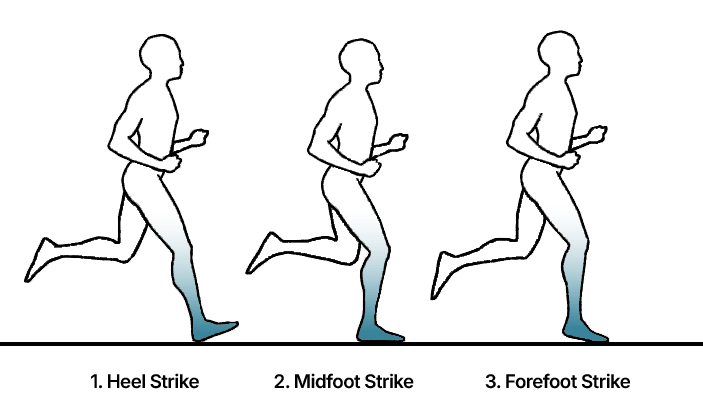
Foot strike in gait analysis refers to the manner in which the foot contacts the ground during walking, jogging, or sprinting. It marks the beginning of the stance phase, during which the body’s weight is transferred onto the leading leg. There are three primary types of foot strikes, categorised based on the part of the foot that first touches the ground:
- Heel Strike (Rearfoot strike): This is the most common type of foot strike, especially in walkers and recreation runners [7]. Here, the heel makes the initial contact with the ground, typically followed by a rolling forward of the foot towards the toes.
- Midfoot Strike: In a midfoot strike, the foot lands flat, with the heel and ball of the foot contacting the ground simultaneously.
- Forefoot Strike (Toe Strike): Forefoot striking involves the ball of the foot or toes contacting the ground first, followed by the heel coming down. It is often observed in sprinters and in elite long-distance runners [7].
Ground Clearance
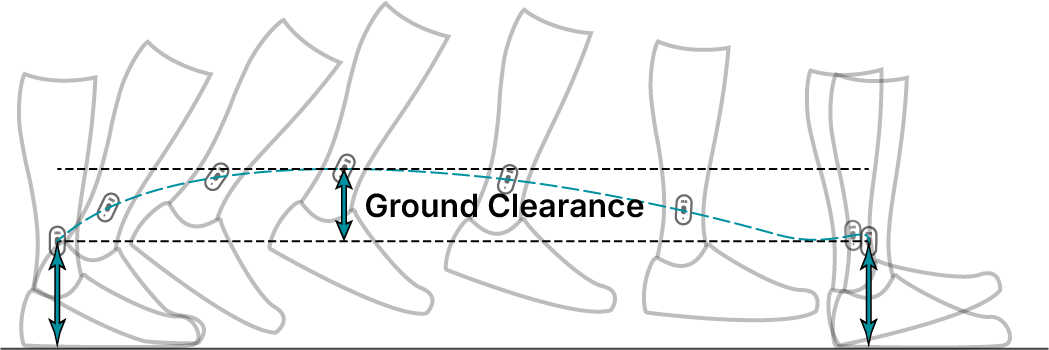
Ground Clearance
Ground clearance in gait refers to the vertical distance between the sole of the foot and the ground surface during the swing phase of the gait cycle. In both sports and clinical application, ground clearance is a vital element that intersects with aspects of biomechanics, performance optimisation, and injury prevention [8].
Stride Length
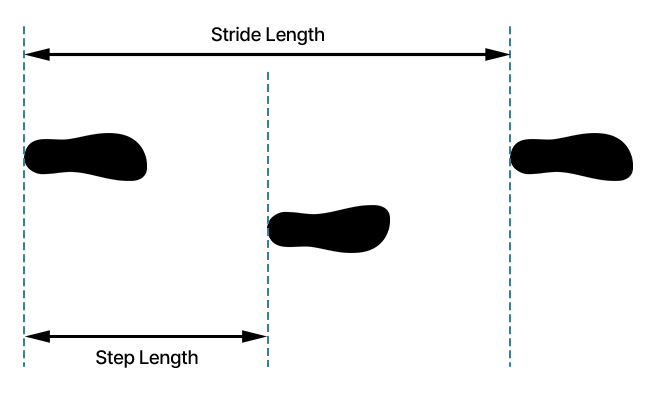
Stride Length
Stride length is defined by the distance between successive initial contacts of the same foot [9] and consist of two step lengths, left and right, each of which is the distance covered by the named foot moves forward in front of the other one. It is a crucial parameter in both gait analysis for health assessment and in sports for performance enhancement. Within the field of sprinting, maximum sprinting speed is a result of an optimal relationship between the step rate and stride length [10].
Step Length
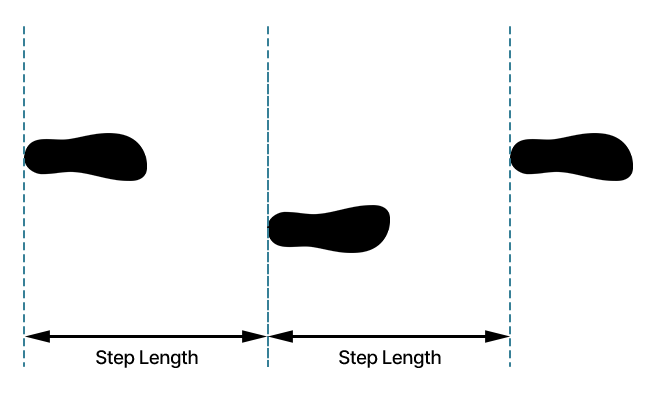
step length
Step length is the distance between the point of initial contact of one foot and the point of initial contact of the opposite foot. Step length is varied on the type of movement an individual is making and measures in the sagittal plane. Unlike stride length, step length can be zero, often seen at the end of a trial where an individual brings both feet together [9]. Step length is strongly correlated with sprint running horizontal velocity with step frequency [11].
Stride Velocity
Stride Velocity
Stride velocity in gait refers to the speed at which an individual walks, measured over each stride, and is the speed the leg moves throughout the swing phase [12]. The two key concepts to understand is mean stride velocity and peak velocity.
- Mean Stride Velocity: This is the average velocity during the swing phase from final contact of one foot until initial contact.
- Peak Stride Velocity: This is the maximum velocity measured during the swing phase, specifically, when the leg is accelerating forwards.
Single Support Time
Single Support Time
Single support time is the duration during a gait cycle when only one foot is in contact with the ground while the other foot is in the swing phase. It occurs twice during each full gait cycle, once for each leg.
Double Support TIme
Double Support TIme
Double support time is the period during the gait cycle when both feet are in contact with the ground simultaneously. It occurs twice in each walking cycle, once at the beginning of the stance phase for one leg and again at the end of the stance phase for the other leg. This phase contributes to stability and typically accounts for about 20–25% of the gait cycle during normal walking.
Duty Factor
Duty Factor
Duty Factor is a dimensionless ratio calculated as the proportion of stride time when the foot is in contact with the ground, calculated in the equation below, where higher duty factors reflect a greater relative contribution of the contact phase [13]. It is often used within sports to categorise where someone sits along a continuum from terrestrial (high duty factor) to aerial (low duty factor) running styles.
Large text to make the stinky
graph big enough to read
Large text to make the stinky
Drive index
Drive Index
This is a dimensionless ratio calculated by:
Large text to make the stinky
graph big enough to read
Large text to make the stinky
Using drive index, coaches are able to classify movement strategies as air-base (low drive index score), ground-based (high drive index score), or a neutral strategy (mid-point drive index value). However, it is crucial to point out no strategy is optimal and each strategy will benefit individuals differently.
Daily Load
Daily Load
Daily Load is the accumulation of Total Load across all sessions and activities performed in a single day. It reflects the overall mechanical stress or movement intensity experienced throughout that day. A higher Daily Load typically indicates greater activity, intensity, or loading impacts, making it a valuable metric for tracking rehabilitation progress, monitoring training load, and identifying asymmetries between the left and right legs.
Large text to make the stinky
graph big read
La
Using drive index, coaches are able to classify movement strategies as air-base (low drive index score), ground-based (high drive index score), or a neutral strategy (mid-point drive index value). However, it is crucial to point out no strategy is optimal and each strategy will benefit individuals differently.
Total Load
Total Load
Total Load is a metric used to quantify the external physical demands placed on an athlete during movement. It is most commonly calculated using accelerometers and is based on a modified vector magnitude. This metric captures the total amount of movement across the three planes: vertical, lateral, and antero-posterior. Total Load represents the sum of all acceleration experienced by a limb during a session, including running, cutting, jumping, and landing, providing a single value that reflects how physically demanding the activity was.
It is calculated for each limb as:
Large text to make the Text Box
graph big enough to read
Large text to make the Large text to make the Text Box
Using drive index, coaches are able to classify movement strategies as air-base (low drive index score), ground-based (high drive index score), or a neutral strategy (mid-point drive index value). However, it is crucial to point out no strategy is optimal and each strategy will benefit individuals differently.
Bibliography
Bibliography
[1] | J. Louden, The clinical orthopedic assessment guide., Kansas: Human Kinetics, 2008. |
[2] | J. Dicharry, "Kinematics and Kinetics of Gait: From Lab to Clinic," Clinics in Sports Medicine, vol. 29, no. 3, pp. 347-364, 2010. |
[3] | A. G. Schubert, J. Kempf and B. C. Heiderscheit, "Influence of Stride Frequency and Length on Running Mechanics," Sports Health, vol. 6, no. 3, pp. 210-217, 2014. |
[4] | J. B. Webster and B. J. Darter, "Principles of Normal and Pathological Gait," in Atlas of Orthoses and Assistive Devices, Amsterdam, Elsevier, 2019, pp. 49-62. |
[5] | G. F. Marchetti, S. L. Whitney, P. J. Blatt, L. O. Morris and J. M. Vance, "Temporal and spatial characteristics of gait during performance of the Dynamic Gait Index in people with and people without balance or vestibular disorders," Physical Therapy, vol. 88, no. 5, pp. 640-651, 2008. |
[6] | J. Bailey, T. Mata and J. A. Mercer, "Is the Relationship Between Stride Length, Frequency, and Velocity Influenced by Running on a Treadmill or Overground?," International Journal of Exercise Science, vol. 10, no. 7, pp. 1067-1075, 2017. |
[7] | M. Shorten and E. Pisciotta, "Running Biomechanics: What did we miss?," in Conference of the International Society of Biomechanics in Sports, Cologne, 2017. |
[8] | B. Mariani, C. Hoskovec, S. Rochat, C. Bula, J. Penders and K. Aminian, "3D gait assessment in young and elderly subjects using foot-worn inertial sensors," Journal of Biomechanics, vol. 43, no. 15, pp. 2999-3006, 2010. |
[9] | S. Dhiman, "A Review of Gait Cycle and its Parameters," International Journal of Computational Engineering & Management, pp. 78-83, 2011. |
[10] | J. Schiffer, "The Sprints," New Studies in Athletics, vol. 24, no. 1, pp. 7-17, 2009. |
[11] | K. Mattes, S. Wolff and S. Alizadeh, "Kinematic Stride Characteristics of Maximal Sprint Running of Elite Sprinters - Verification of the "Swing-Pull Technique"," Journal of Human Kinetics, vol. 77, pp. 15-24, 2021. |
[12] | C. Mitschke, P. Kiesewetter and T. L. Milani, "The Effect of the Accelerometer Operating Range on Biomechanical Parameters: Stride Length, Velocity, and Peak Tibial Acceleration during Running," Sensors, vol. 18, no. 1, p. 130, 2018. |
[13] | B. Hanley, C. B. Tucker, L. Gallagher, P. Parelkar, L. Thomas, R. Crespo and R. J. Price, "Grizzlies and gazelles: Duty factor is an effective measure for categorizing running style in English Premier League soccer players," Frontiers in Sports and Active Living, vol. 4, 2022. |
[14] | Karlon, A., & Frid, L. (2015). The“butterfly diagram”: A gait marker for neurological and cerebellar impairment in people with multiple sclerosis. Journal of the Neurological Sciences, 358, 92-100. |
Gait
Gait

Plyometrics
Plyo

Balance
